MSP revenue dashboards usually fall into one of two ditches. Either they're optimistic spreadsheets — "we're at $80k MRR" based on what plans you're supposed to be billing, not what you actually invoiced — or they're accounting-software reports (QuickBooks, Xero, Sage, take your pick) built for a CPA, not for the person trying to run an MSP. Both miss the questions you actually have: how much did each client pay last month? Did the new Silver plan migration take? Is February's spike real or noisy? What's the projected revenue if this month's pace holds?
Morton Command Center grounds every number in your accounting system's invoice history and rebuilds the engine around the questions an MSP owner asks daily. The revenue engine itself is a native feature — included out of the box. The connector that feeds it your invoices is built custom to your stack as part of your engagement: the platform runs on a vendor-agnostic adapter pattern, so whatever accounting system you run — QuickBooks Desktop, QuickBooks Online, Xero, Sage, NetSuite, or anything with an API — we build that integration for your shop rather than asking you to switch tools. During your build, we map your item taxonomy, your contract shapes, and your plan names into the engine — so the MRR breakdown reflects your billing structure, not a generic template.
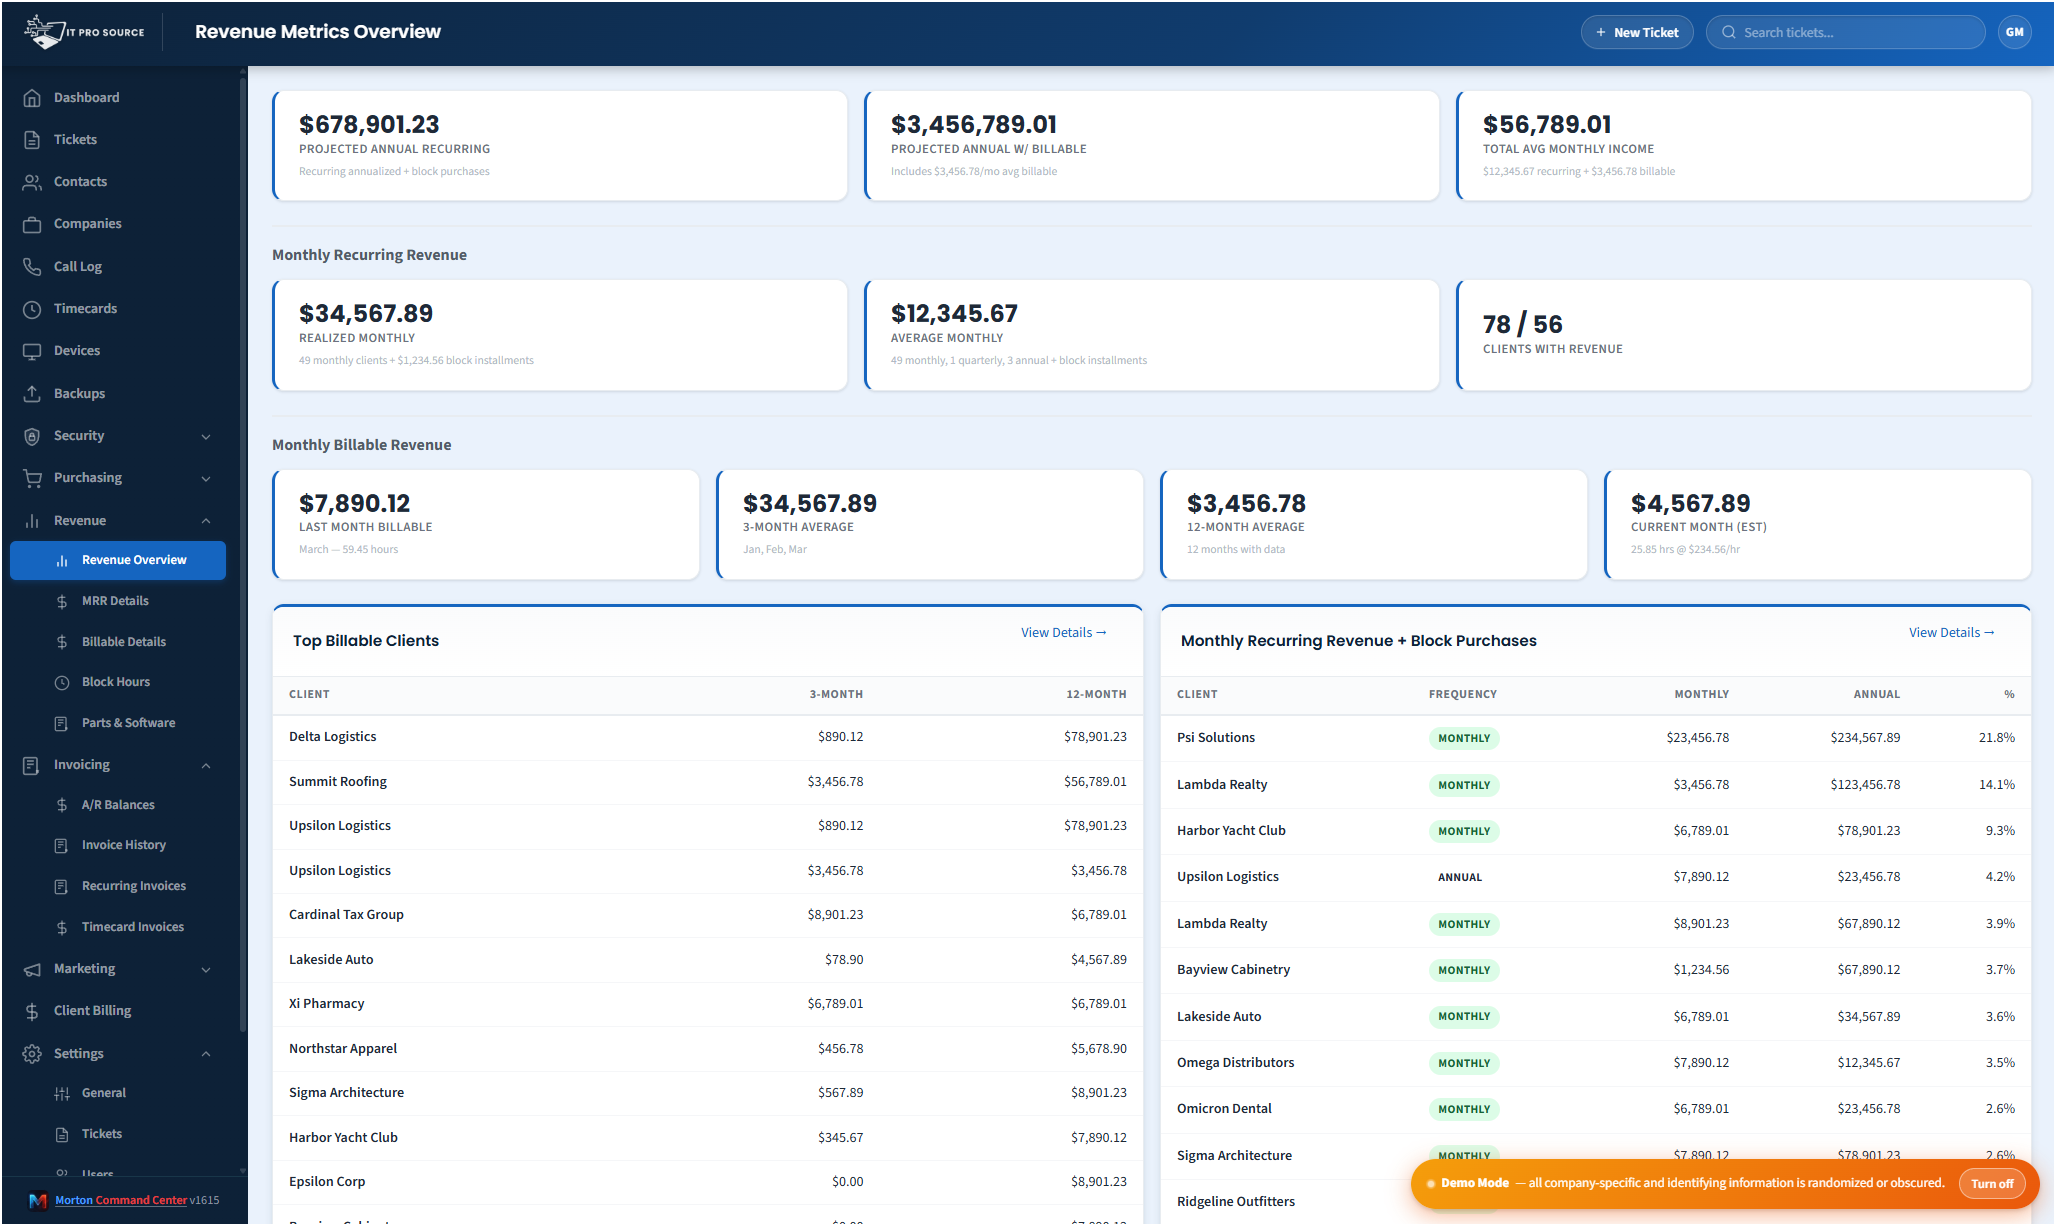
Top KPIs you can trust
- Projected ARR — annual recurring + block hour purchases. The number you'd quote a buyer.
- Average Total Monthly Revenue — MRR + 12-month average billable labor. The "what should I expect this month" figure.
- MRR — recurring contracts only, predictable each month. The figure that doesn't move when a busy month happens.
- Outstanding AR — total positive customer balance straight from your accounting system. Click-target for collections.
A scope caption directly above the cards spells out exactly what's included: "Top KPIs reflect recurring service revenue + billable labor only. One-time parts, software, and shipping appear on the Total Invoiced chart below." No buried assumptions.
Per-month historic MRR — from invoices, not a flat baseline
The 12-month trend chart isn't a horizontal "your current MRR projected backwards" lie. Under the hood, a recurring-revenue engine walks every invoice line, classifies it by your item taxonomy and customer billing config, and powers the MRR breakdown by contract type. The result: February's annual-payment spike shows up. The Essentials → Silver plan migration shows up as a step change. The reality you bill is the reality the chart reflects.
Total Invoiced chart — the inclusive view
Right next to the MRR-aware trend, a Total Invoiced chart sums every dollar invoiced per month — labor, parts, software, shipping, credits. Matches your AI-style "sum the invoices for last month" cross-check exactly. Useful when you want to see total cash-flow shape vs the predictable-revenue shape side by side.
Current month so far + projected end of month
The Current Month card on the Monthly Billable Revenue strip splits the cell: MTD on the left (with day-of-month and hours-so-far context), projected end of month on the right (linear projection of the current pace). At a glance you know both where you stand AND where you'll likely land if this week's pace holds.
Top clients — by MRR and by billable hours
Two bottom panels, 50/50 split:
- Monthly Recurring Revenue + Block Purchases — sorted by annualized recurring value descending. Frequency pill (monthly / quarterly / annual), monthly recurring amount, annual figure including block-hour purchases.
- Top Billable Clients — sorted by 12-month billable revenue. 3-month vs 12-month columns to see whose billable activity is trending up.
Unmapped-items warning banner
When customers have billing-config items that don't resolve to an item in your accounting system (a QuickBooks item, or the equivalent in whatever platform we've integrated for your stack), those lines silently leak into Other Revenue and quietly inflate it. The unmapped-items banner sits directly above the hero KPIs whenever any customer has unmapped recurring items, naming the count and the monthly leak total with a one-click link to the audit page. The bug that used to hide for months is now in your face until you fix it.
Block-hour accounting that distinguishes installment from lump-sum
A separate strip below the Billable Revenue cards tracks: this-year lump-sum block-hour purchases ($X this year, NOT in MRR), monthly installment block plans ($Y/month, counted in MRR), and active block-plan client count + total block-hour value. The "is this MRR or a one-time bump" ambiguity gets resolved up-front.
Demo mode that respects screenshots
Every dollar, every customer name, every hours figure obscures consistently when demo mode is toggled — same entity always renders as the same pseudo-value across the page, so screenshots feel coherent. Great for sales decks, training videos, and screen-shares.
Your accounting system stays where it is
Morton Command reads from your existing accounting data — no migration, no parallel entry, no cutover. Your invoices, your customers, your history stay exactly where they are. Worst case you cancel and your books are untouched. The integration is built custom to your stack: whether your shop runs QuickBooks Desktop, QuickBooks Online, Xero, Sage, NetSuite, or any other accounting platform that exposes an API, we build the connector for your exact setup as part of your engagement — if it has an API, we integrate it. That's the advantage over rigid all-in-one suites that force you onto their pre-built connectors: yours is built to fit your tools, not the other way around.
Pricing
Flat monthly pricing — no per-seat fees, no per-vendor surcharge. See current pricing on the homepage →
Ready to talk?
The first call is a 30-minute discovery — we map your accounting taxonomy (QuickBooks or whatever you run), your contract types, and the questions you'd want this dashboard to answer on day one. No commitment, no sales pressure.
Questions first? Email [email protected] or read the FAQ.