Know your MRR without rebuilding a spreadsheet.

Morton Command Center turns your real billing data into a revenue dashboard — monthly and annual recurring revenue, revenue by client, and month-over-month trends, all computed from the invoices and contracts you already maintain. No manual tallying, no stale exports.

One source of truth for revenue. The MRR you see on the dashboard, in a client's profile, and inside a report all come from the same calculation — so the numbers always agree across the app.

MRR & ARR
Computed from billing data, not typed in
By client
Top accounts ranked by recurring revenue
One number
The same figure everywhere it appears
The complete picture

Your revenue, computed for you

Morton Command Center reads your billing configuration and invoice history, then derives the metrics you'd otherwise rebuild by hand every month — so you can answer "how are we doing?" in seconds.

MRR and ARR at a glance

Your monthly recurring revenue and its annualized figure sit front and center, alongside the current month's invoiced total and a projection for where it's heading. The numbers come from your actual billing config and invoice records — not a flat baseline you have to maintain — so they reflect the contracts you really have.

Trends from real invoices

Historic month-by-month MRR is derived from the invoices you actually sent — not a single number repeated across the chart. A total-invoiced view sits beside it, so you can see how recurring revenue and one-off billings have moved together over time and spot a dip before it becomes a surprise.

Revenue by client

See which accounts carry the business. Top clients are ranked by MRR and by billable hours, so you know where your recurring revenue concentrates and which relationships matter most. Block-hour accounting — installment versus lump-sum — is broken out, and anything not yet mapped gets flagged so it isn't quietly left out.

Feature spotlight

The revenue overview, up close

Here's the revenue dashboard in action — MRR, the current and projected month, historic trends, and your top clients, all on one screen and all drawn from the same billing data.

See it in action
cc.yourmsp.com
Revenue overview in Morton Command Center showing monthly recurring revenue, the current and projected month, a historic MRR trend derived from invoices, and top clients ranked by recurring revenue
Sample layout
The revenue overview pulls MRR, current and projected month, the historic trend, and top clients into one view — every figure computed from the same billing data the rest of Morton Command Center uses.

Most MSPs can't answer "what's our MRR right now?" without opening a spreadsheet, exporting from the accounting system, and hoping the last person to touch the file kept it current.

The problem isn't that the data doesn't exist. It's that the data lives in three different places — your billing setup, your invoice history, your time-tracking tool — and nobody has stitched them into a number you can trust on demand.

Morton Command Center does the stitching.

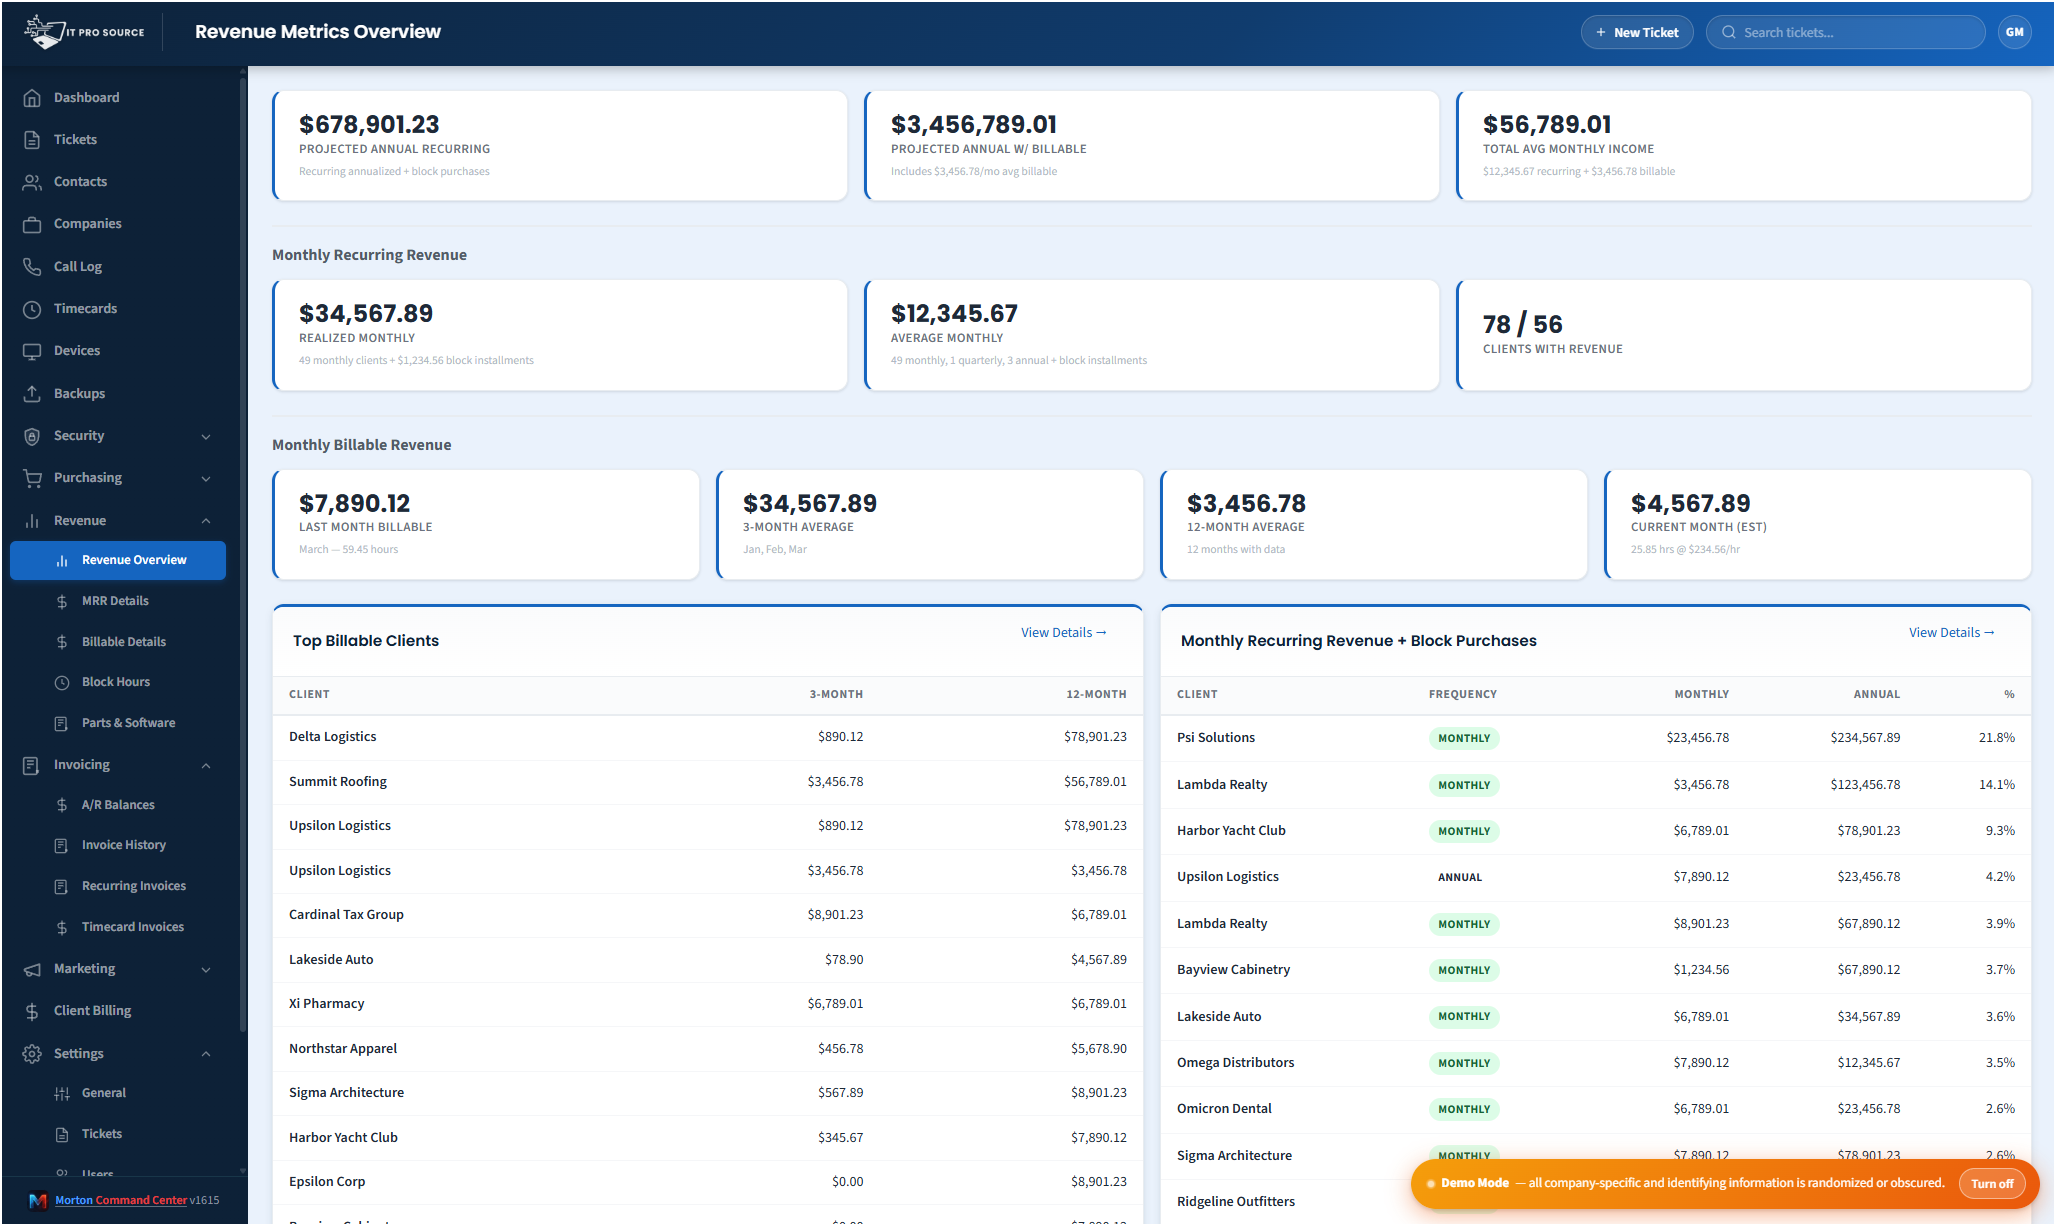
It reads your billing configuration, your accounting system's invoice records, and your billable time, then derives the revenue picture for you: recurring revenue, what you've invoiced this month, where it's trending, and which clients drive it. We build your accounting integration custom to your stack — if your tool has an API, we build the integration for it. The dashboard is the report — there's nothing to rebuild.

Computed from billing data, not typed in

The metrics on the revenue dashboard aren't figures someone keys in and forgets to update. They're computed.

Monthly recurring revenue is derived from your billing config and the plans your clients are actually on. Historic month-by-month MRR comes from the invoices you genuinely sent — so the trend line reflects reality, not a flat baseline copied across twelve cells. The current month, the projected month, and the total-invoiced view all trace back to the same underlying records.

Because the numbers are derived rather than entered, they update as your billing changes. Add a client, change a plan, push a new invoice run — and the next time the dashboard warms, the revenue picture moves with it.

One source of truth for every revenue number

This is the part that matters most, and it's the reason the dashboard exists at all.

In a lot of tool stacks, the MRR on a summary screen and the MRR on a client's record are calculated two different ways, by two different people, and they quietly disagree. Someone notices in a board meeting. Trust in the numbers evaporates.

Morton Command Center calculates revenue once. The MRR you see on the revenue overview is the same figure that appears on a company's profile and inside a revenue report, because they all read from the same billing summary. There isn't a "dashboard number" and a "real number" — there's one number, surfaced wherever it's relevant.

That consistency is deliberate. When everyone is looking at the same calculation, conversations about pricing, churn, and growth start from agreement instead of an argument about whose spreadsheet is right.

Know which clients carry the business

A single MRR figure tells you the size of the business. The client breakdown tells you its shape.

Morton Command Center ranks your top clients by recurring revenue and by billable hours, so you can see where revenue concentrates. Block-hour arrangements are accounted for separately — installment versus lump-sum — so prepaid work doesn't distort the recurring picture. And when something in your billing isn't mapped yet, the dashboard flags it rather than silently leaving it out of the totals.

Built on the data you already have

Nothing here requires you to re-enter your business into a new system.

The revenue dashboard reads from your existing stack. Your accounting system feeds the invoice history the MRR trend is built from — we build that integration custom to your setup, whether your books live in the cloud or on-premises. Billable details, where you use them, come from your time-tracking tool, wired in the same way. Your billing tiers, plans, and contract rules live in your Morton Command Center billing configuration, where you set them up once.

This is the advantage: it's built to fit your exact stack, not the other way around. Other accounting systems — QuickBooks Online, Xero, Sage, or anything that publishes an API — get wired into your build the same way, custom to your tools. The same goes for your time-tracking tool and the rest of your stack: if your tool has an API, we build the integration for it. No forcing your business onto a rigid suite's pre-set connectors — your accounting system stays exactly where it is; nothing migrates.

Accurate numbers depend on accurate setup

The revenue dashboard is only as good as the billing configuration behind it, and we're upfront about that.

MRR, ARR, and the client breakdown all depend on your plans, rates, and vendor mappings being in place. That's why setting them up is part of your build, not an afterthought — we map your contracts and pricing rules so the derived numbers match what you actually charge. The unmapped-items warning is there precisely so gaps surface instead of hiding inside a total.

The revenue analytics view is one of the newer, evolving areas of the platform. The core math — MRR from billing config, historic trend from real invoices, top clients by revenue — is what powers it today, and it gets sharper as your billing data does.

Numbers within minutes, refreshed on a schedule

Morton Command Center keeps its data warm on a schedule rather than recomputing everything on every page load, so the dashboard opens fast.

Revenue figures reflect your billing data as of the last sync — within minutes, not instantly — and a manual refresh is always one click away when you want the very latest. It's near-real-time visibility into the numbers that decide how your MSP is doing, without the wait of a heavy report rebuild.

Pricing

Morton Command Center uses transparent flat-rate pricing — no per-seat, per-client, or per-invoice fees. Whether you track revenue across 10 clients or 100, your monthly cost is the same. See current pricing on the homepage →

Founding Five program is active — the first five customers lock in their rate for the lifetime of their account. See current pricing on the homepage →

Related solutions

Revenue is one view of your finances; here's how it connects to the rest of Morton Command Center:

  • Accounts Receivable — Revenue tells you what you earned; A/R tells you what's still owed.
  • Automated Invoicing — Where the revenue numbers originate: the invoices the dashboard is built from.
  • MSP Efficiency — One place for your numbers, so the whole team stops hunting for the truth.

Ready to see your real MRR?

If you're still rebuilding a revenue spreadsheet every month — or quietly distrusting the numbers when you do — Morton Command Center was built to give you one revenue dashboard you can actually rely on.

We'll map your billing config, your contracts, and your invoice history, then show you what your MRR, trends, and top-client breakdown look like computed from your own data.

One 30-minute call and you'll never rebuild that spreadsheet again.

Schedule a Consultation

Questions first? Email [email protected] or read the FAQ.